 MomentumSift
Learn
Launch app →
MomentumSift
Learn
Launch app →
Unusual options activity scanner
Find the largest, most unusual options bets in the market each day, ranked by the premium that is actually at risk, with the noise that clutters most flow scanners stripped out.
Open the scanner →What it shows
Most "unusual options activity" feeds are dominated by the same handful of mega-cap names, index ETFs, and deep in-the-money contracts that are really just stock substitutes. Ours is built to surface genuine, fresh, directional bets instead:
- Ranked by time-value premium. A deep in-the-money block can show a huge dollar figure that is almost all intrinsic value. We rank by the extrinsic (time-value) premium so real speculative bets rise to the top, not stock replacements.
- One row per name. A single symbol cannot flood the board with a dozen adjacent strikes.
- Index ETFs excluded. No SPY / QQQ / IWM bloat, so single-name conviction stands out.
- Directional by default. The board leans to clearly bought or sold flow, with an option to include mid-market prints.
- Fresh positioning flagged. A NEW badge marks contracts where volume runs well above open interest, a sign of new positioning rather than churn.
- Multi-day repeat flow. A separate view tracks names seeing sustained buying across several sessions, not just a one-day spike.
- A daily spotlight highlights the single standout print of the day.
Example: what MomentumSift shows
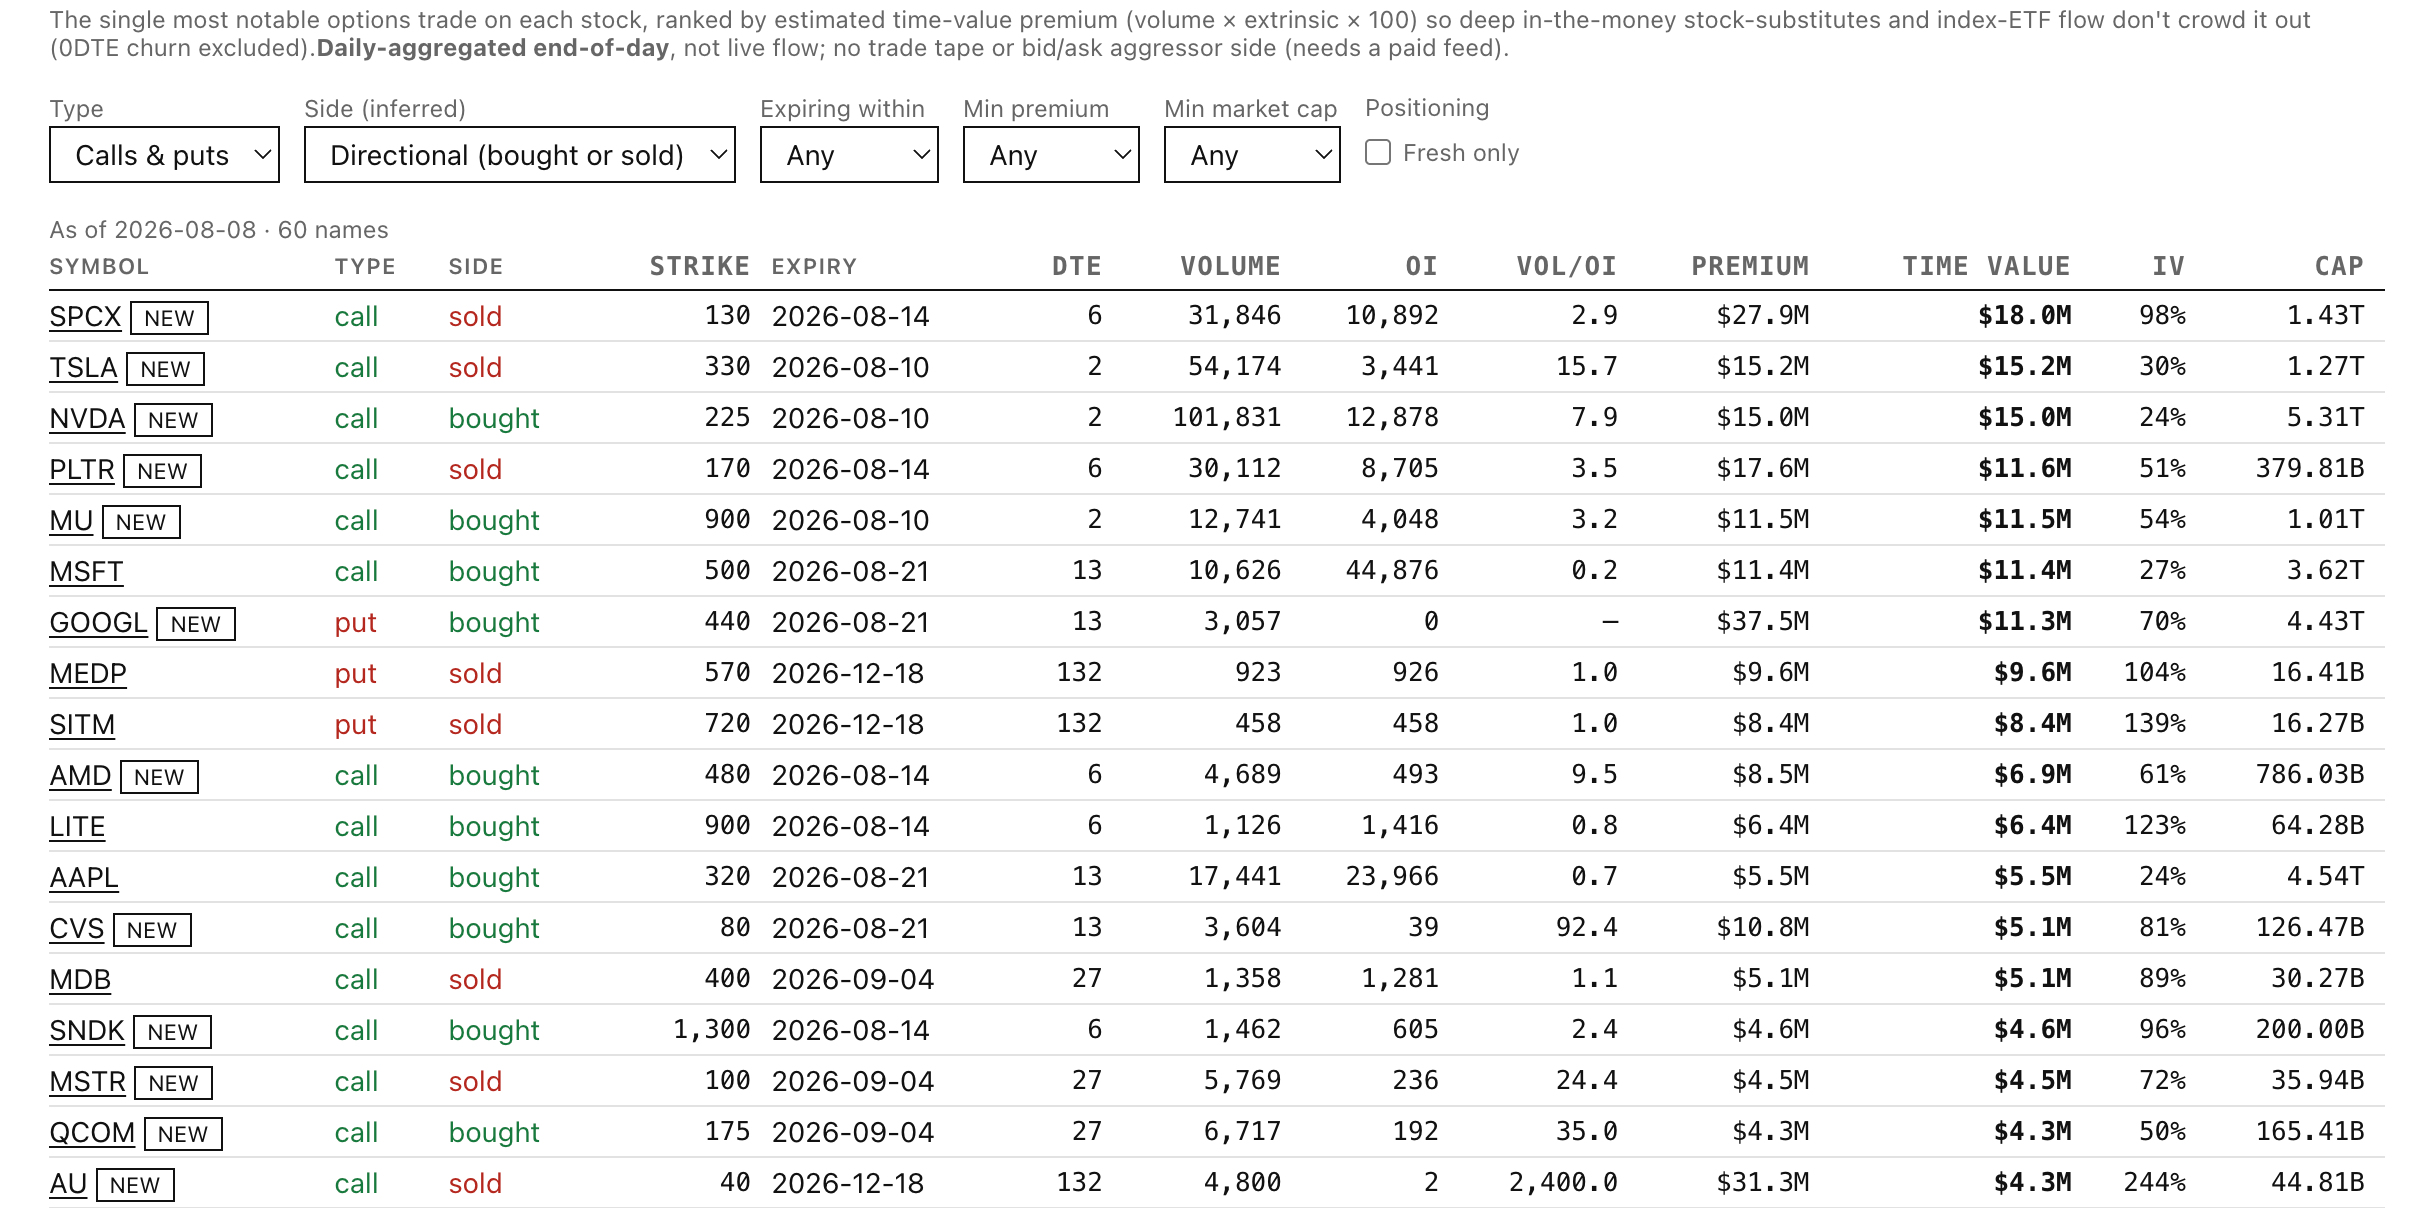
This is the main board. Every row is the single most notable trade on one stock, ranked by estimated time-value premium so deep in-the-money stock substitutes and index-ETF flow do not crowd out real speculation. The VOL/OI column and the NEW badge flag fresh positioning (volume above open interest), and the filters across the top narrow by type, inferred side, expiry, minimum premium, and market cap.
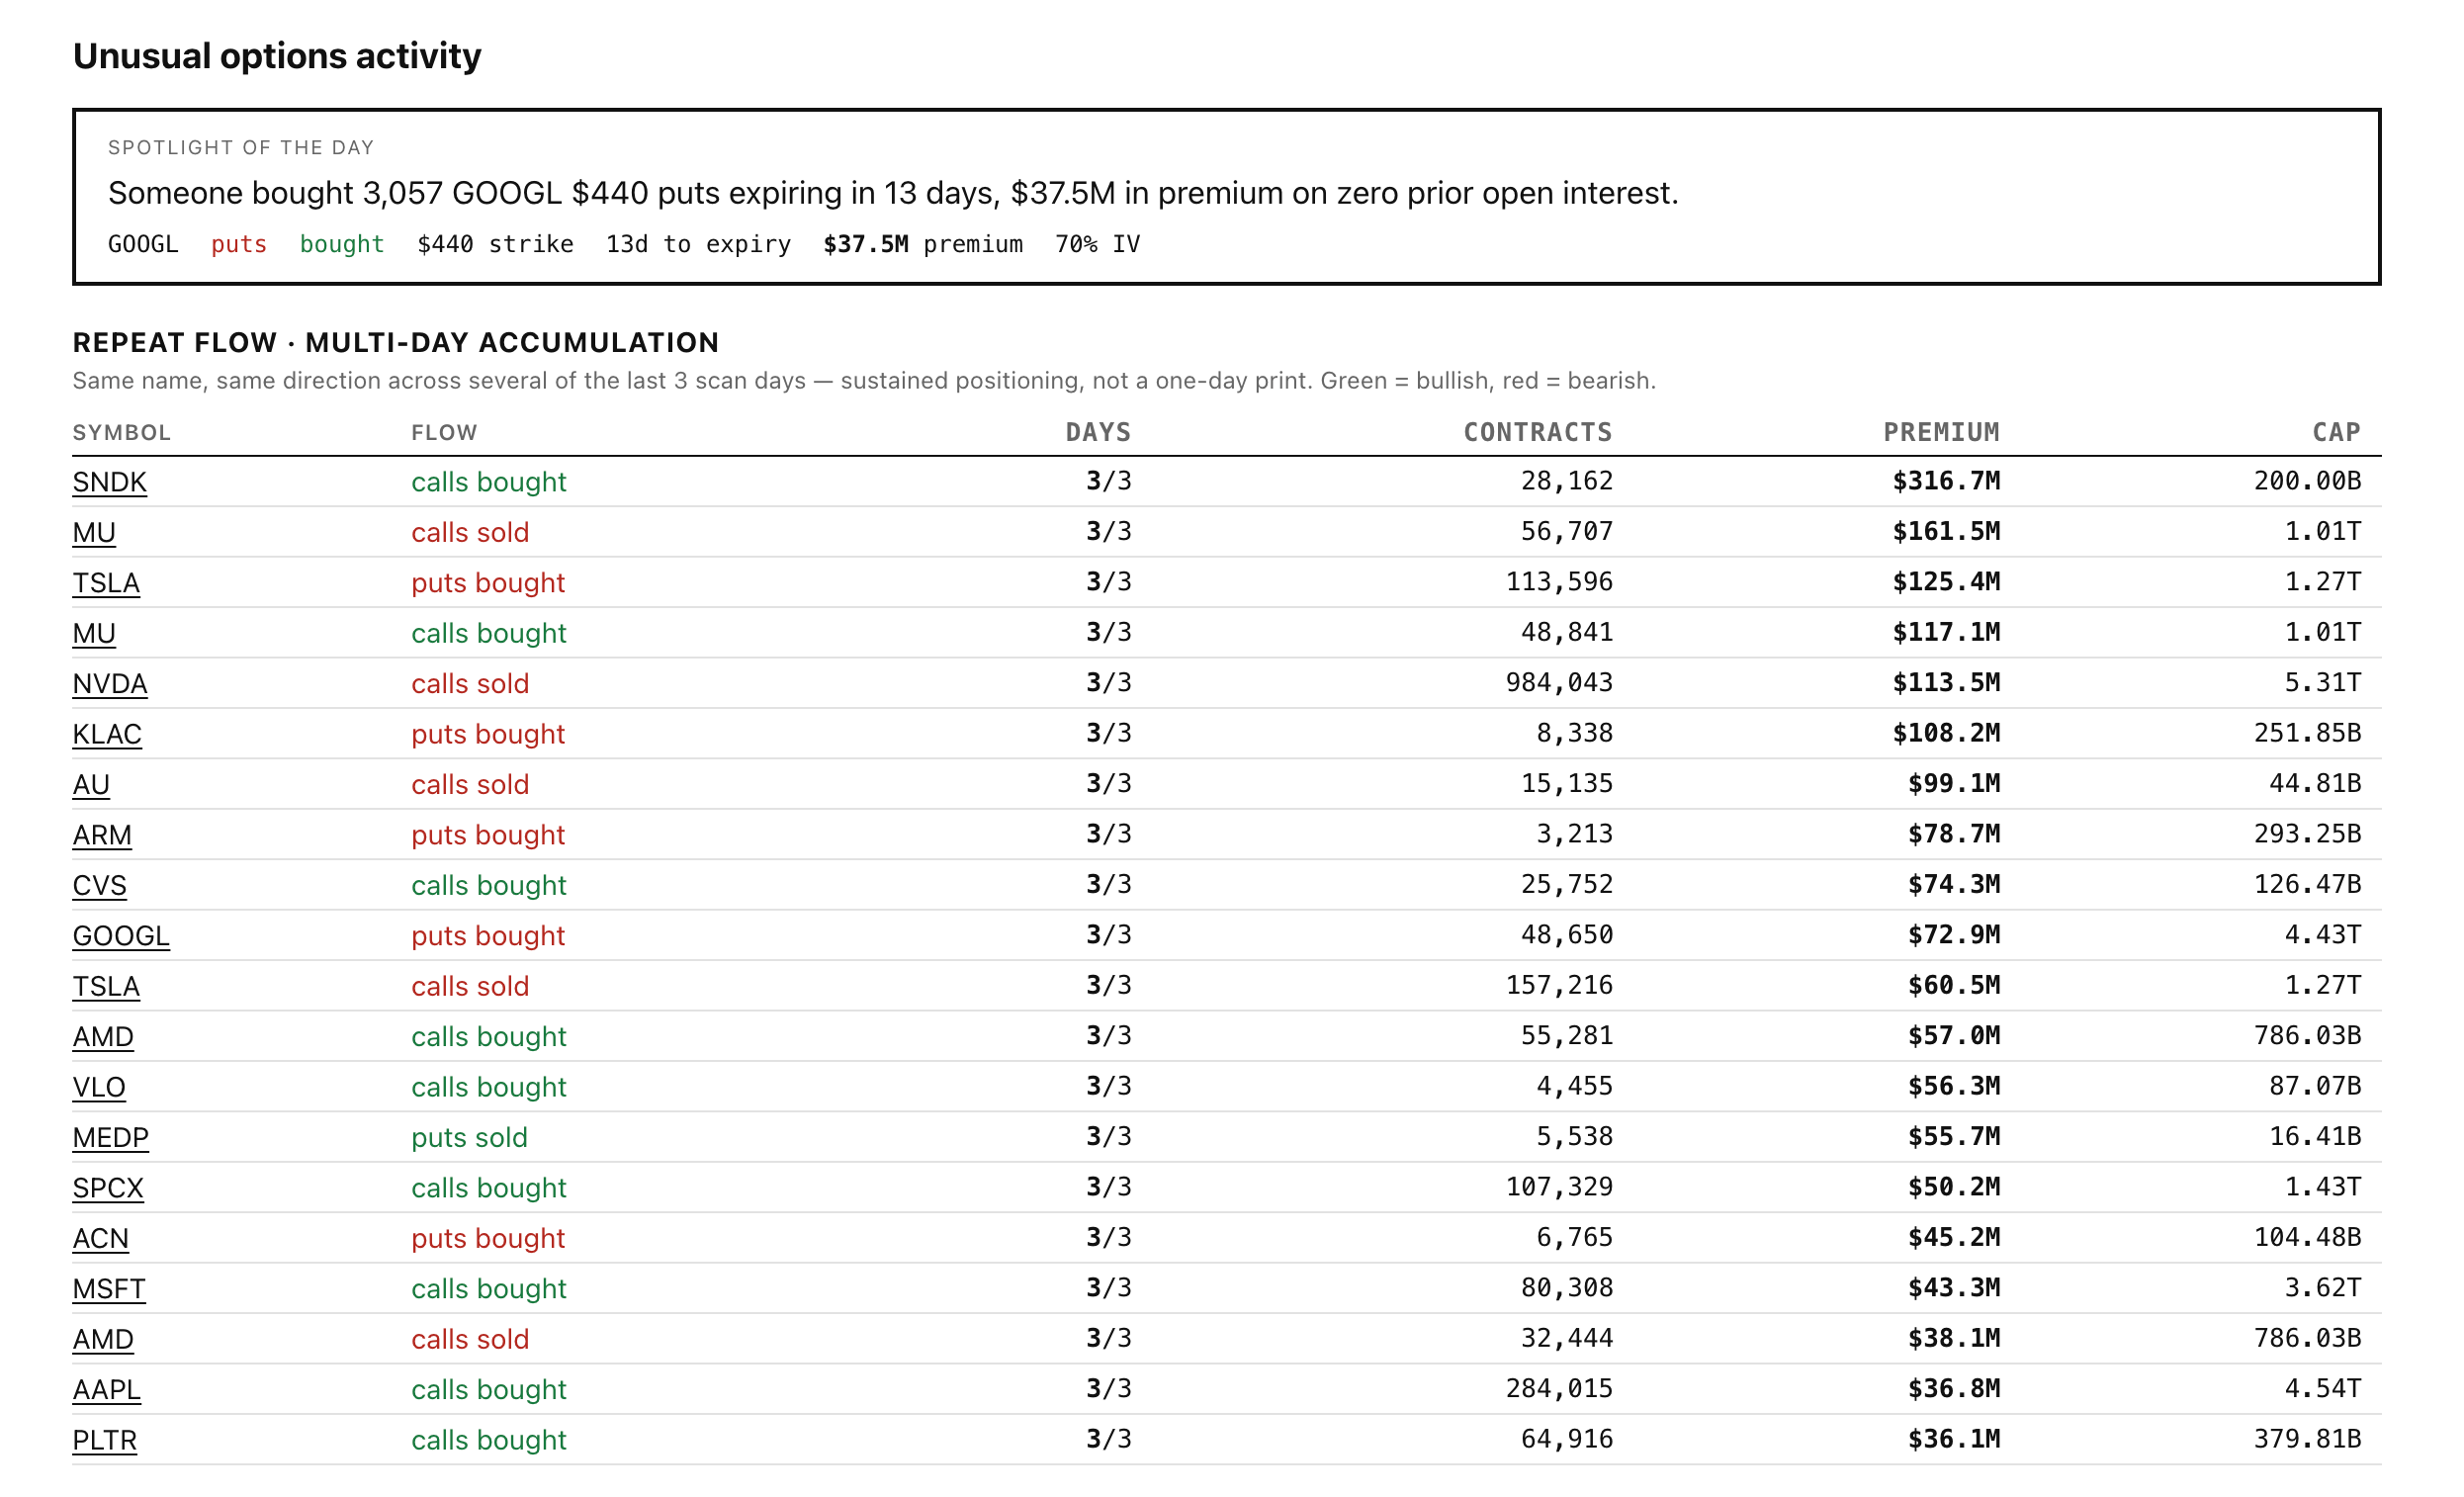
Two things sit above the board. The Spotlight of the day calls out the single most striking print (here, a $37.5M GOOGL put buy on zero prior open interest), and Repeat flow tracks names bought or sold in the same direction across several of the last scan days, which is much closer to sustained accumulation than a one-day spike.
How it works, honestly
The scanner is built from a daily options chain snapshot: aggregated volume for the session, not a live trade-by-trade tape. Because of that, the "bought vs sold" side is inferred from price relative to the bid and ask, not confirmed from an exchange aggressor flag, and open interest reflects the prior day's settled figure. That is plenty to spot large, unusual positioning, but it is a research signal, not a broker feed.
How to use it
Treat a standout print as a question, not an answer. The most useful setups tend to be fresh, directional, large-premium bets in a single name that line up with the stock's underlying trend. Cross-check the flow against the chart, the earnings calendar, and open-interest positioning before you read anything into it. Learn the concept in depth in what is unusual options activity.
Open the scanner →FAQ
- What is unusual options activity?
- It is when a contract trades far more than normal, either on huge volume or on volume above its open interest, often signalling a large new directional bet. See the full explainer.
- Is the scanner free?
- Yes, it is free while MomentumSift is in beta. Create a free account to use it.
- Is it real-time?
- No. It is built from an end-of-day chain snapshot with aggregated daily volume, not a live trade tape. Open interest settles the next morning.
- What does "fresh positioning" mean?
- Daily volume well above existing open interest, which suggests new positions are being opened rather than existing contracts changing hands.