 MomentumSift
Learn
Launch app →
MomentumSift
Learn
Launch app →
Golden cross screener
Find stocks that just formed a 50/200-day golden cross, computed nightly and confirmed on the close, then see how that same stock behaved after every past cross.
Open the screener →What it shows
- Fresh 50/200 crosses. Names where the 50-day average has just crossed above (golden) or below (death) the 200-day.
- Confirmed on the close. Crosses are evaluated on end-of-day data, so you are not reacting to an intraday cross that reverses before the bell.
- A per-stock track record. On any stock's page, a golden cross backtest shows what happened after each past cross: the run to the next death cross, the peak gain, the worst drawdown, and forward returns at 3, 6, and 12 months.
- Screenable alongside everything else in the terminal: relative strength, momentum score, distance from 52-week high, and sector strength.
How it works
Every night the pipeline recomputes the 50-day and 200-day simple moving averages from end-of-day closes for the whole universe and records the exact date any cross occurs. Because the full price history is stored, the same engine can look backward: for each historical golden cross on a given name it measures the run until the next death cross and the forward return, so a signal comes with that stock's own base rates instead of a generic claim.
Example: what MomentumSift shows
Here is the golden cross track record for Robinhood (HOOD) as it appears on the stock's overview page. A golden cross went active on 2026-08-07. Above the table, a plain-English line summarises the previous cross, and the table lists every cross in about five years of history with how each one played out: the run to the next death cross, the peak gain, the worst drawdown, and forward returns at three, six, and twelve months.
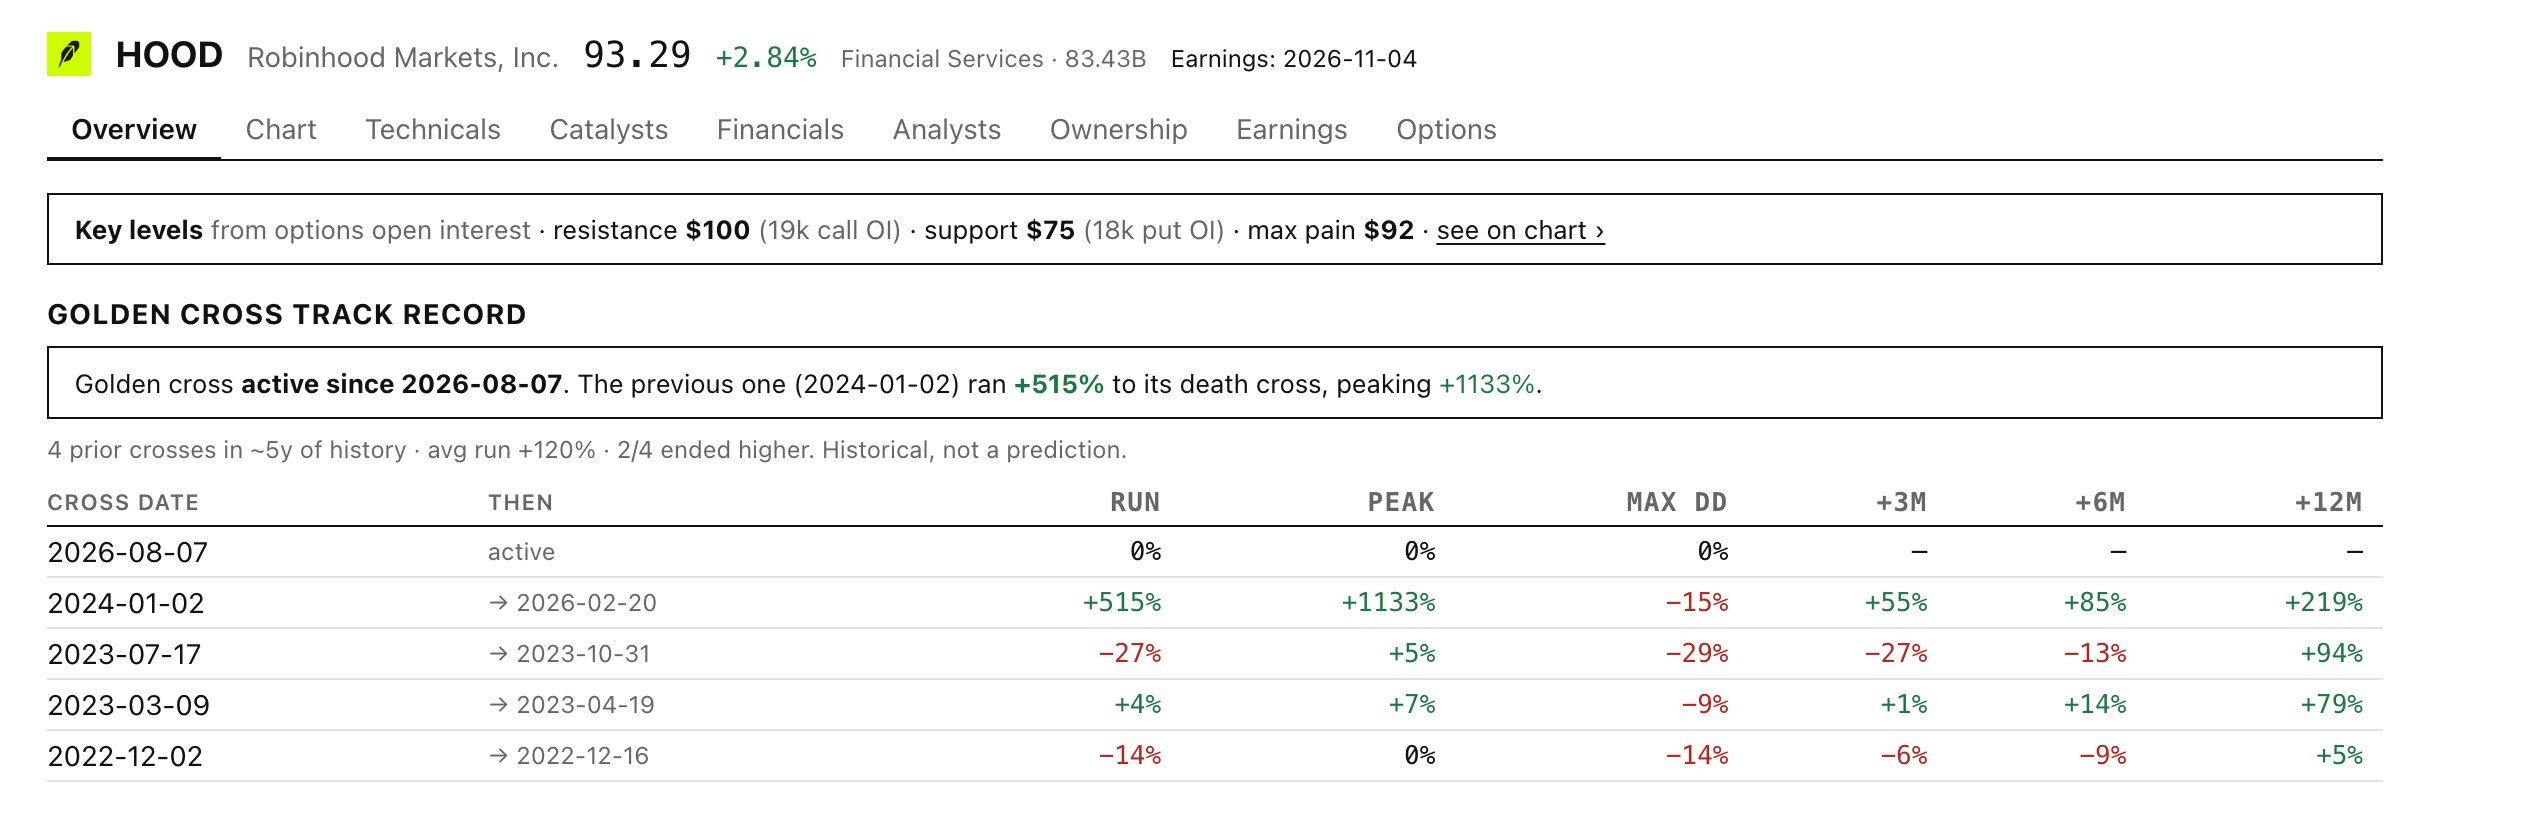
The value is in the base rates, not a single number. HOOD's previous cross (2024-01-02) was a big winner: it ran +515% to its death cross and peaked +1133%, with +55%, +85%, and +219% at three, six, and twelve months. But the record is honestly mixed. Of the four prior crosses only two ended higher, and the late-2022 and mid-2023 signals whipsawed for losses. That is exactly the point: you see the winners and the duds side by side and judge the odds yourself, instead of trusting a signal blindly.
How to use it
Use the cross as a trend filter, not a standalone buy signal. The strongest candidates tend to pair a fresh golden cross with high relative strength and a constructive track record after past crosses. Read the concept in full in what is a golden cross.
Open the screener →FAQ
- What is a golden cross?
- When a stock's 50-day moving average crosses above its 200-day moving average, a widely watched sign the long-term trend has turned bullish. See the full explainer.
- Daily, weekly, or monthly?
- The screener works from daily closes. The same 50/200 logic can be read on longer timeframes; a weekly golden cross is slower and rarer but tends to filter out more noise.
- Does a golden cross guarantee gains?
- No. It is a lagging indicator that can whipsaw. That is exactly why each name shows its own historical track record rather than a blanket promise.